Safai Saathi Utthaan Helpline Dashboard • UNDP • 2024
Putting 41,314 invisible workers on record
Most sanitation workers and waste pickers in India had no formal record anywhere, so no welfare scheme could find them. This dashboard gave UNDP and its partner organisations one shared place to register, track and support them.
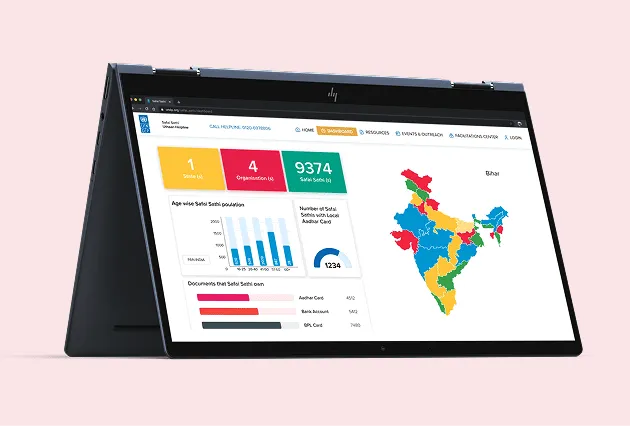
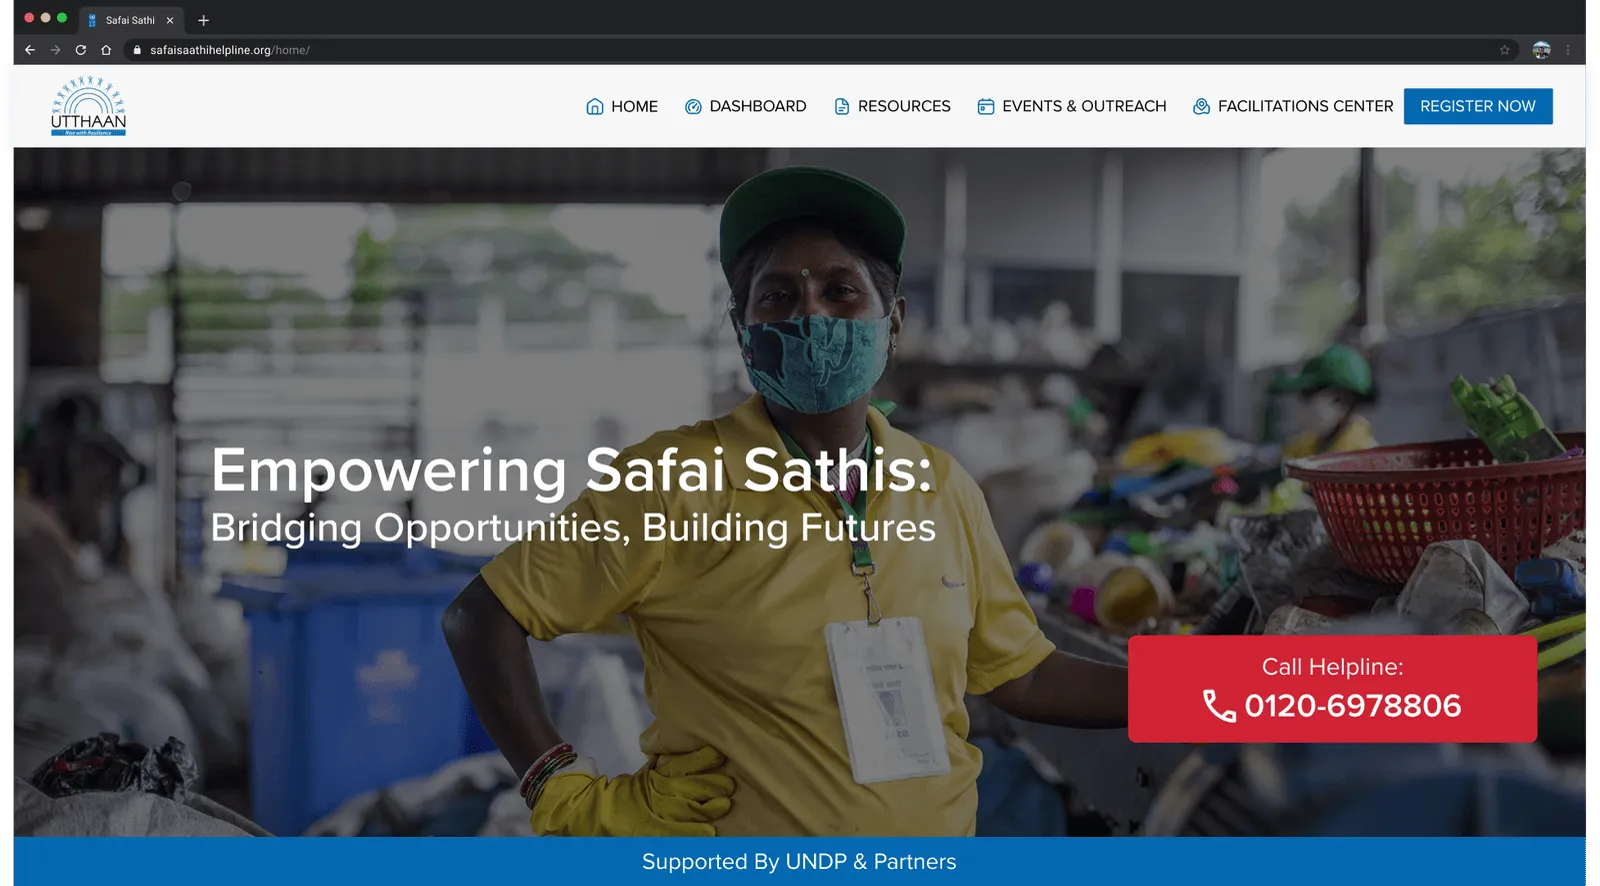
The public face of the helpline.
Situation
People the system could not see
Workers had no documentation and no way to prove income or residence. Partner NGOs were already collecting their details in the field, but each in its own format, with nowhere shared to put it.
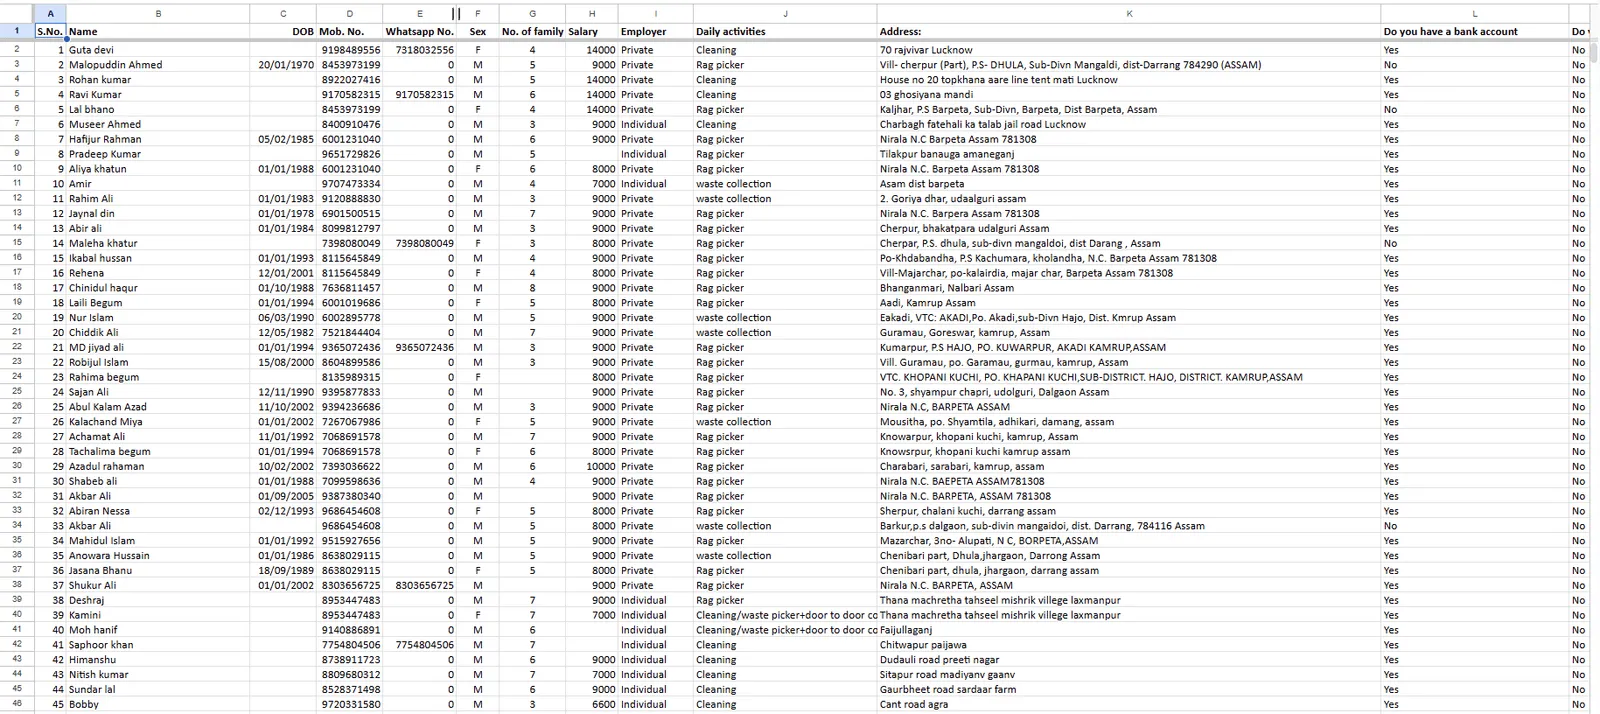
What the data looked like when it arrived.
- 13partner organisations
- 13different ways of recording a worker
- 0shared systems
Task
One place where every worker can be found
- Register workers one by one or in bulk
- Track who has documents and scheme access
- Show the gaps state by state
I was the UX designer, working with one developer over about two months.
Action
The hard part was the data, not the interface
1. Made 13 formats agree
Before any screen, we sat with how each organisation gathered data, mapped how the fields related, and agreed one standard template: 58 fields across the formats became 24. It was not a difficult problem. It was a heavy one, and everything else depended on it.
Thirteen formats in, one template out.
2. Gave data two ways in
Field staff register a single worker through a form. Organisations with existing records upload a standardised CSV.
3. Designed the dashboard around the gaps
Search, filters and scheme tracking sit on top of state-wise views of who has documentation, who does not, and where the gaps are.
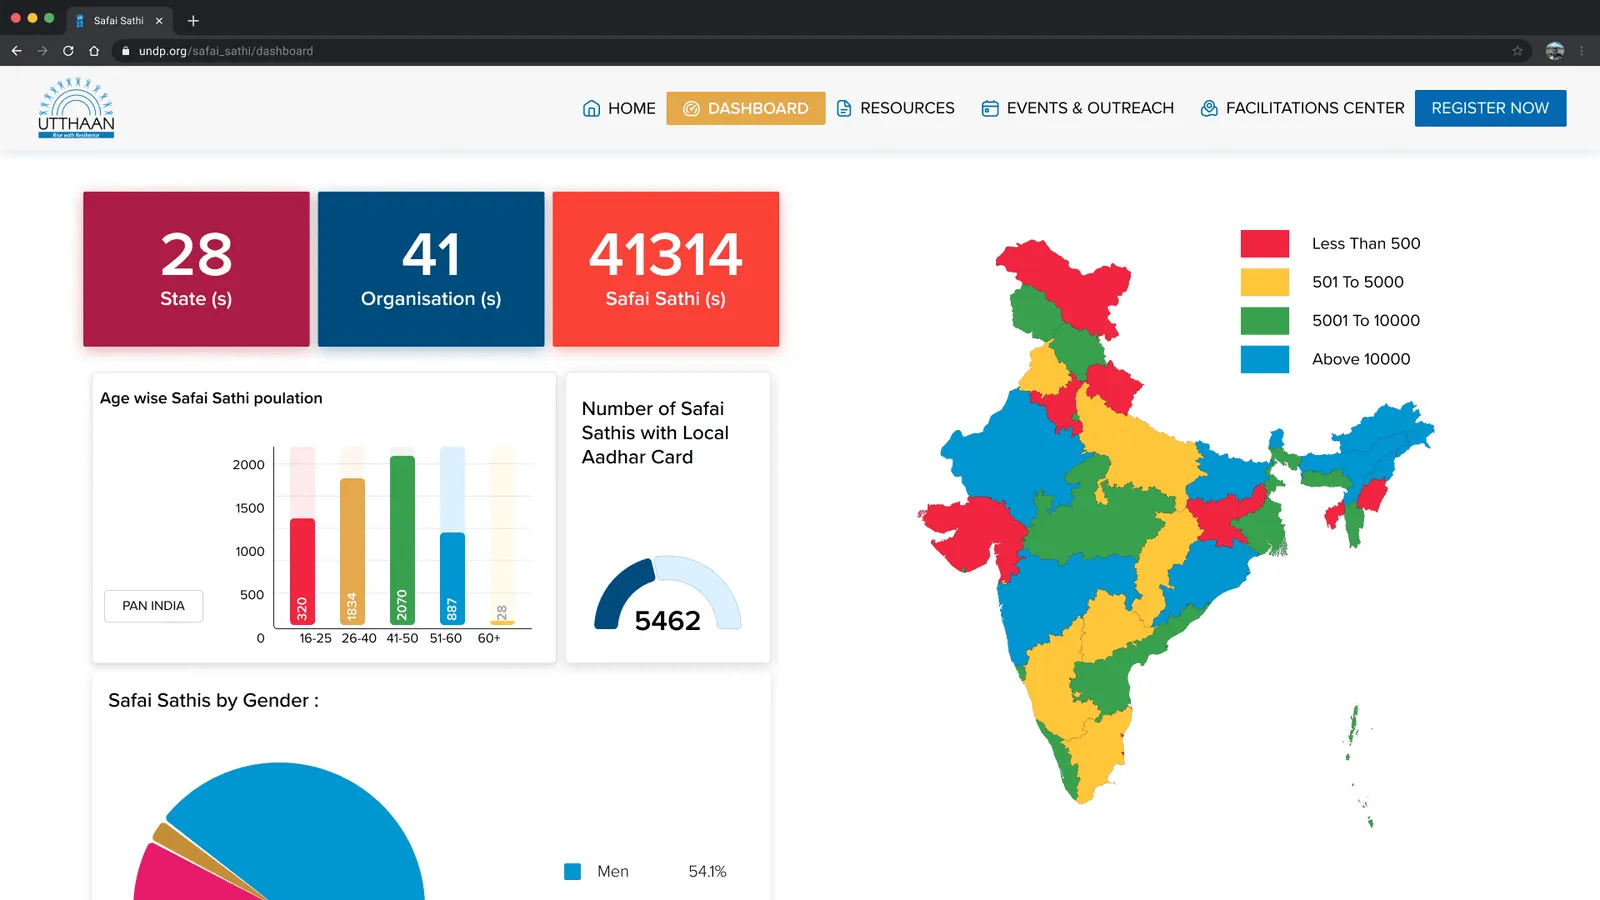
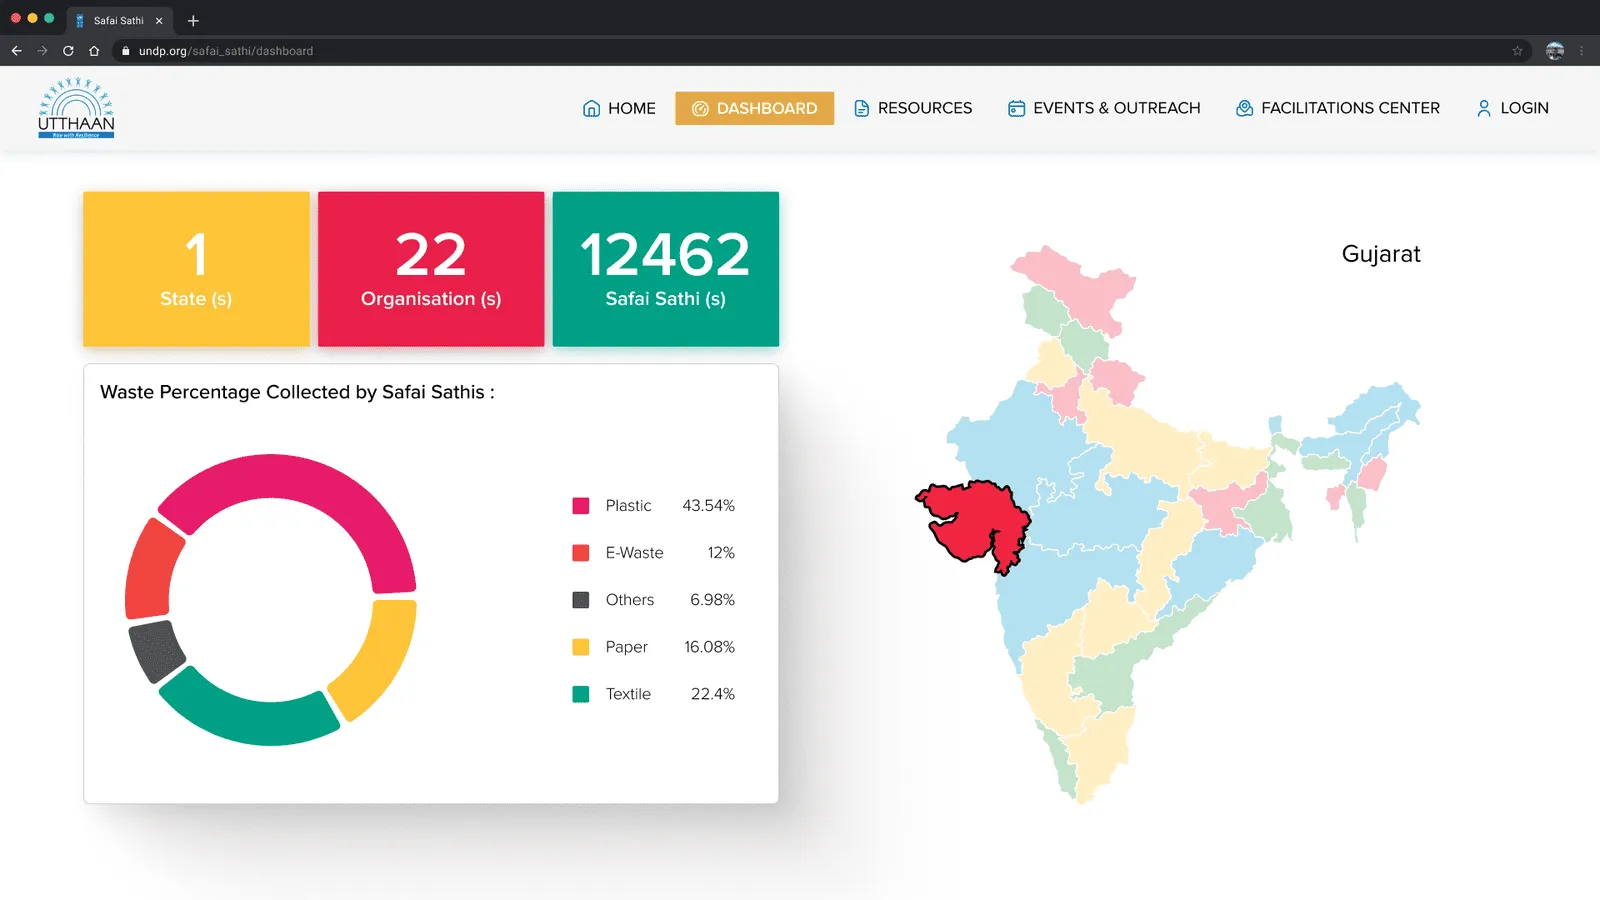
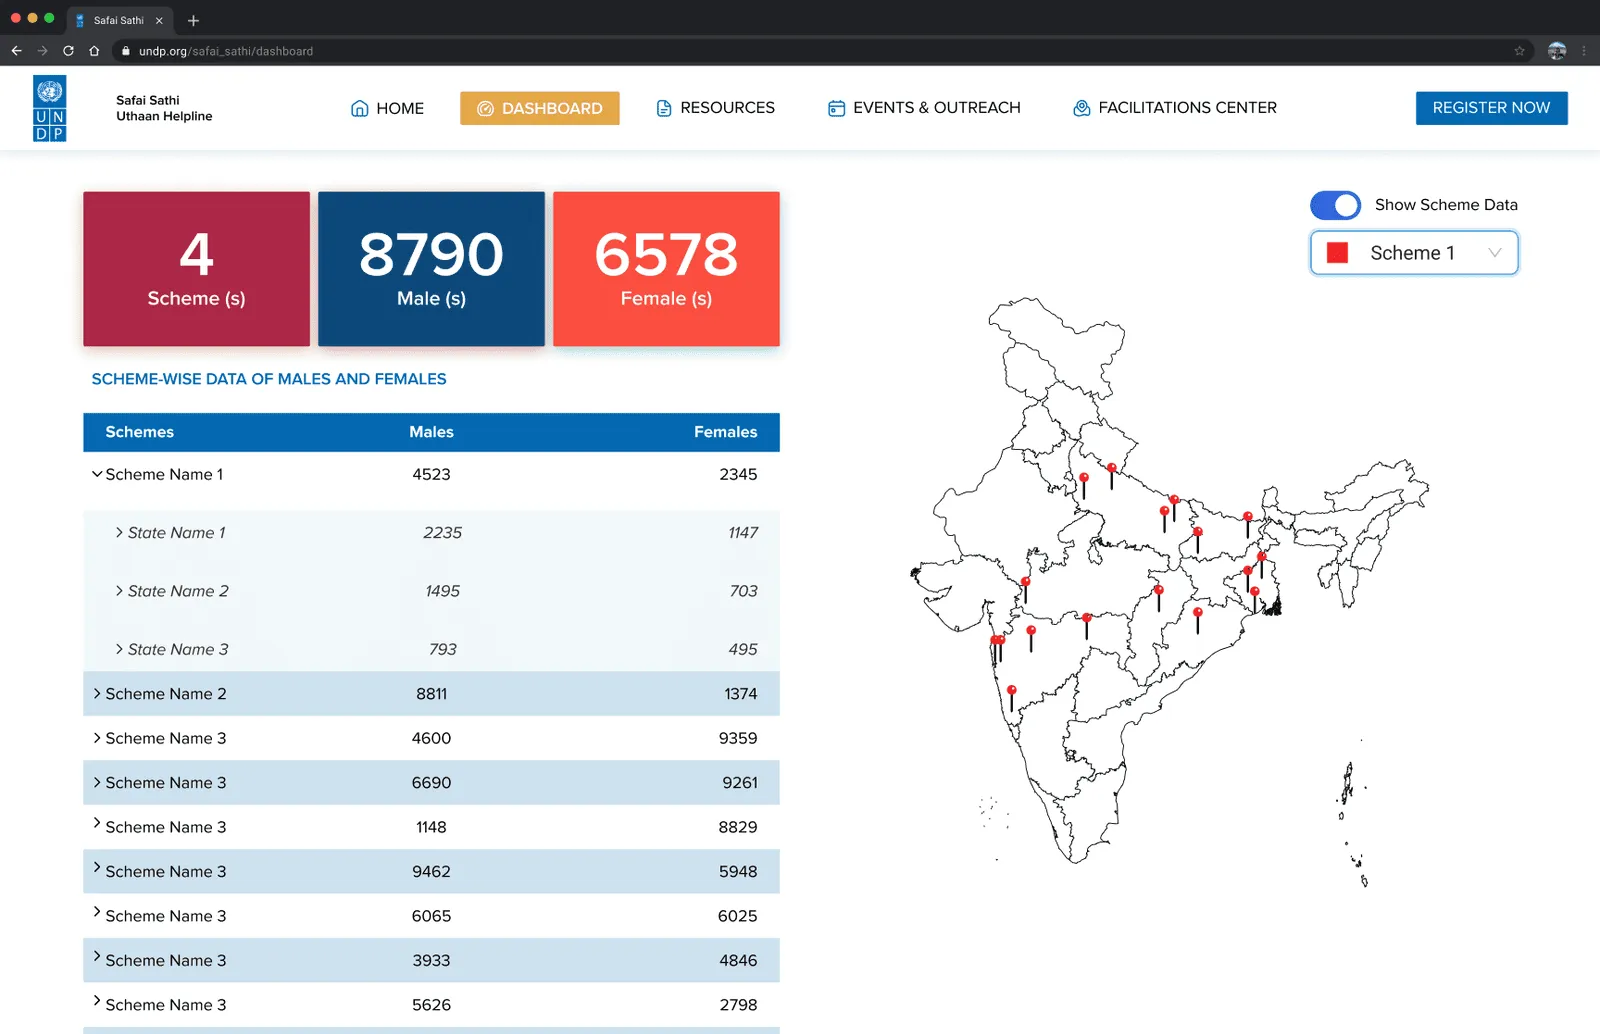
Scheme access by gender (mock-up data).
4. Built the helpline around it
A resource and knowledge centre, an events and outreach section, and a facilitation centre that points workers to their nearest Common Service Centre.
Result
41,314 reasons to say yes
- 41,314workers searchable and trackable within a few months
- 29states
- 13partner organisations
- 2 daysfor a partner to bring in its existing records
Reflection
What I took from it
- 1Design the template firstThe screens were quick once the data agreed. The template was the real design work.
- 2Test with field staffWe designed the form with the organisations. I would also watch it used in the field, on the phones staff actually carry.
- 3Heavy is not the same as hardMost of this project was patience. That is still design.
More case studies