DS Techworks Solutions Pvt. Ltd., a leader in innovative tech
solutions since 2007, excels in digital signage and interactive displays. They transform
spaces with services like digital signage, interactive kiosks, and transparent displays.
Committed to enhancing operations and engaging customers, Techworks combines technical
expertise and creative ingenuity to exceed client expectations.
Problem Statement
Codify is a unified tracking system that streamlines POSM management
from production to retail deployment using QR codes for real-time tracking. It provides
actionable insights, reduces resource wastage, and enhances operational efficiency.
The existing POSM management process lacked end-to-end traceability, resulting in limited
visibility of deployment, untracked inventory movement, and inefficiencies in resource
utilization, leading to increased costs and reduced operational effectiveness.
The Problem
Before Codify, the POSM lifecycle was segmented into three disconnected stages:
POSM Production & Dispatch: POSM materials were fabricated based on
requirements and dispatched from vendors to Warehouse Service Providers (WSPs).
Storage & Issuance by WSPs: Materials were stored by WSPs and issued to
Warehouse Distributors (WDs).
Market Deployment by WDs: WDs deployed POSMs to retail locations, often
through Team Leads (TLs) or third-party resources.
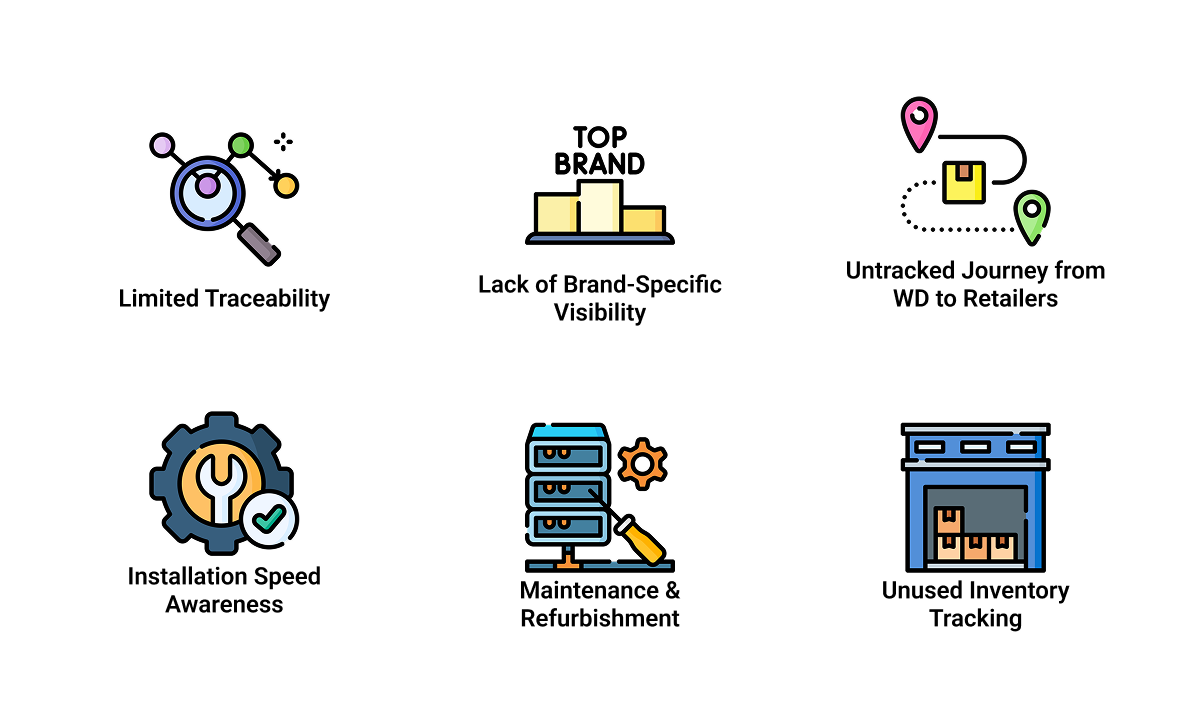
Challenges Identified:
Limited Traceability: Tracking stopped at the WSP stage, leaving no record
of POSM journeys post-deployment.
Lack of Brand-Specific Insights: Deployment lacked visibility across
brands.
Untracked Movement: Movement from WDs to retailers remained undocumented.
Unknown Installation Speeds: Companies had no way to monitor the time taken
for POSM installation.
Neglected Maintenance: POSM longevity was untracked, complicating
refurbishment efforts.
Unused Inventory Waste: Surplus inventory often went unnoticed and unused.
The Research & Design Process
1. Empathizing with Stakeholders
We conducted interviews with stakeholders, including:
Brand Managers: Struggling with the lack of brand-specific deployment data.
WSP and WD Representatives: Frustrated by inefficiencies in manual
inventory tracking.
Deployment Teams: Overburdened with paperwork and tracking duties.
Key Insights:
Stakeholders required a system that provided end-to-end traceability.
Simplicity was crucial to ensure ease of adoption by deployment teams.
Solution Needed:
-> A Unified Tracking System to track the journey of POSM from print to last mile retail
store.
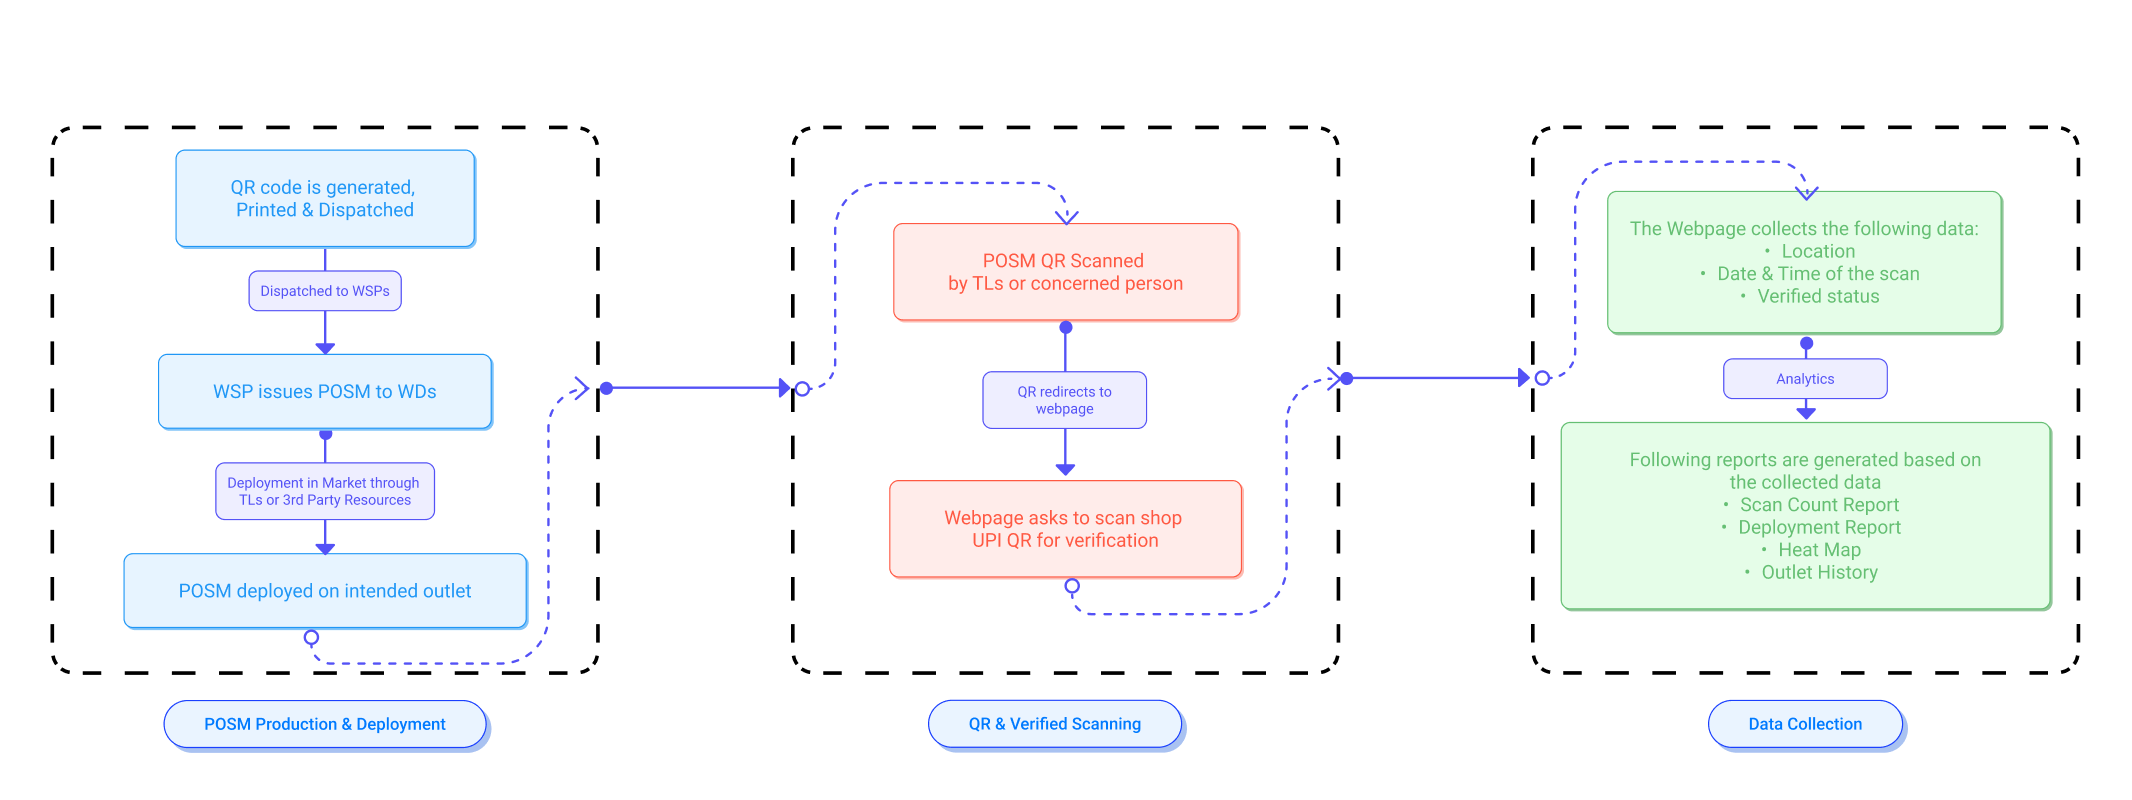
Flow chart of the new process
Defining Goals
Based on insights, we set out to create a dashboard that:
Offers real-time tracking of POSM from production to deployment.
Provides brand-specific and location-specific analytics.
Simplifies the workload for deployment teams.
Ideation & Prototyping
We brainstormed solutions, ranging from RFID-based tracking to NFC tags.
Ultimately, we opted for a QR code system for its simplicity, cost-effectiveness, and
scalability.
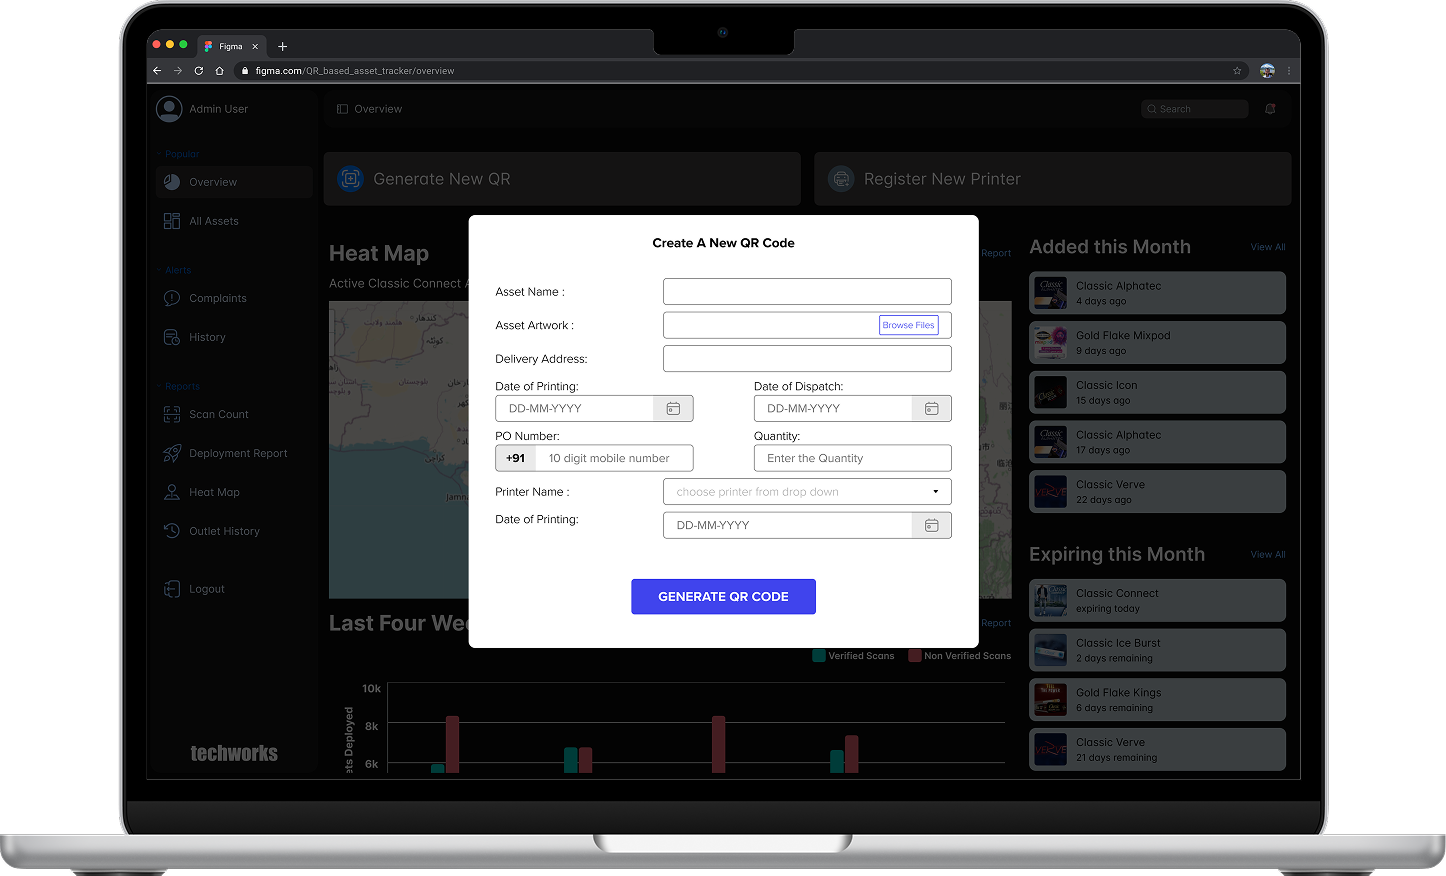
Designing the Codify Dashboard
Key features of the dashboard:
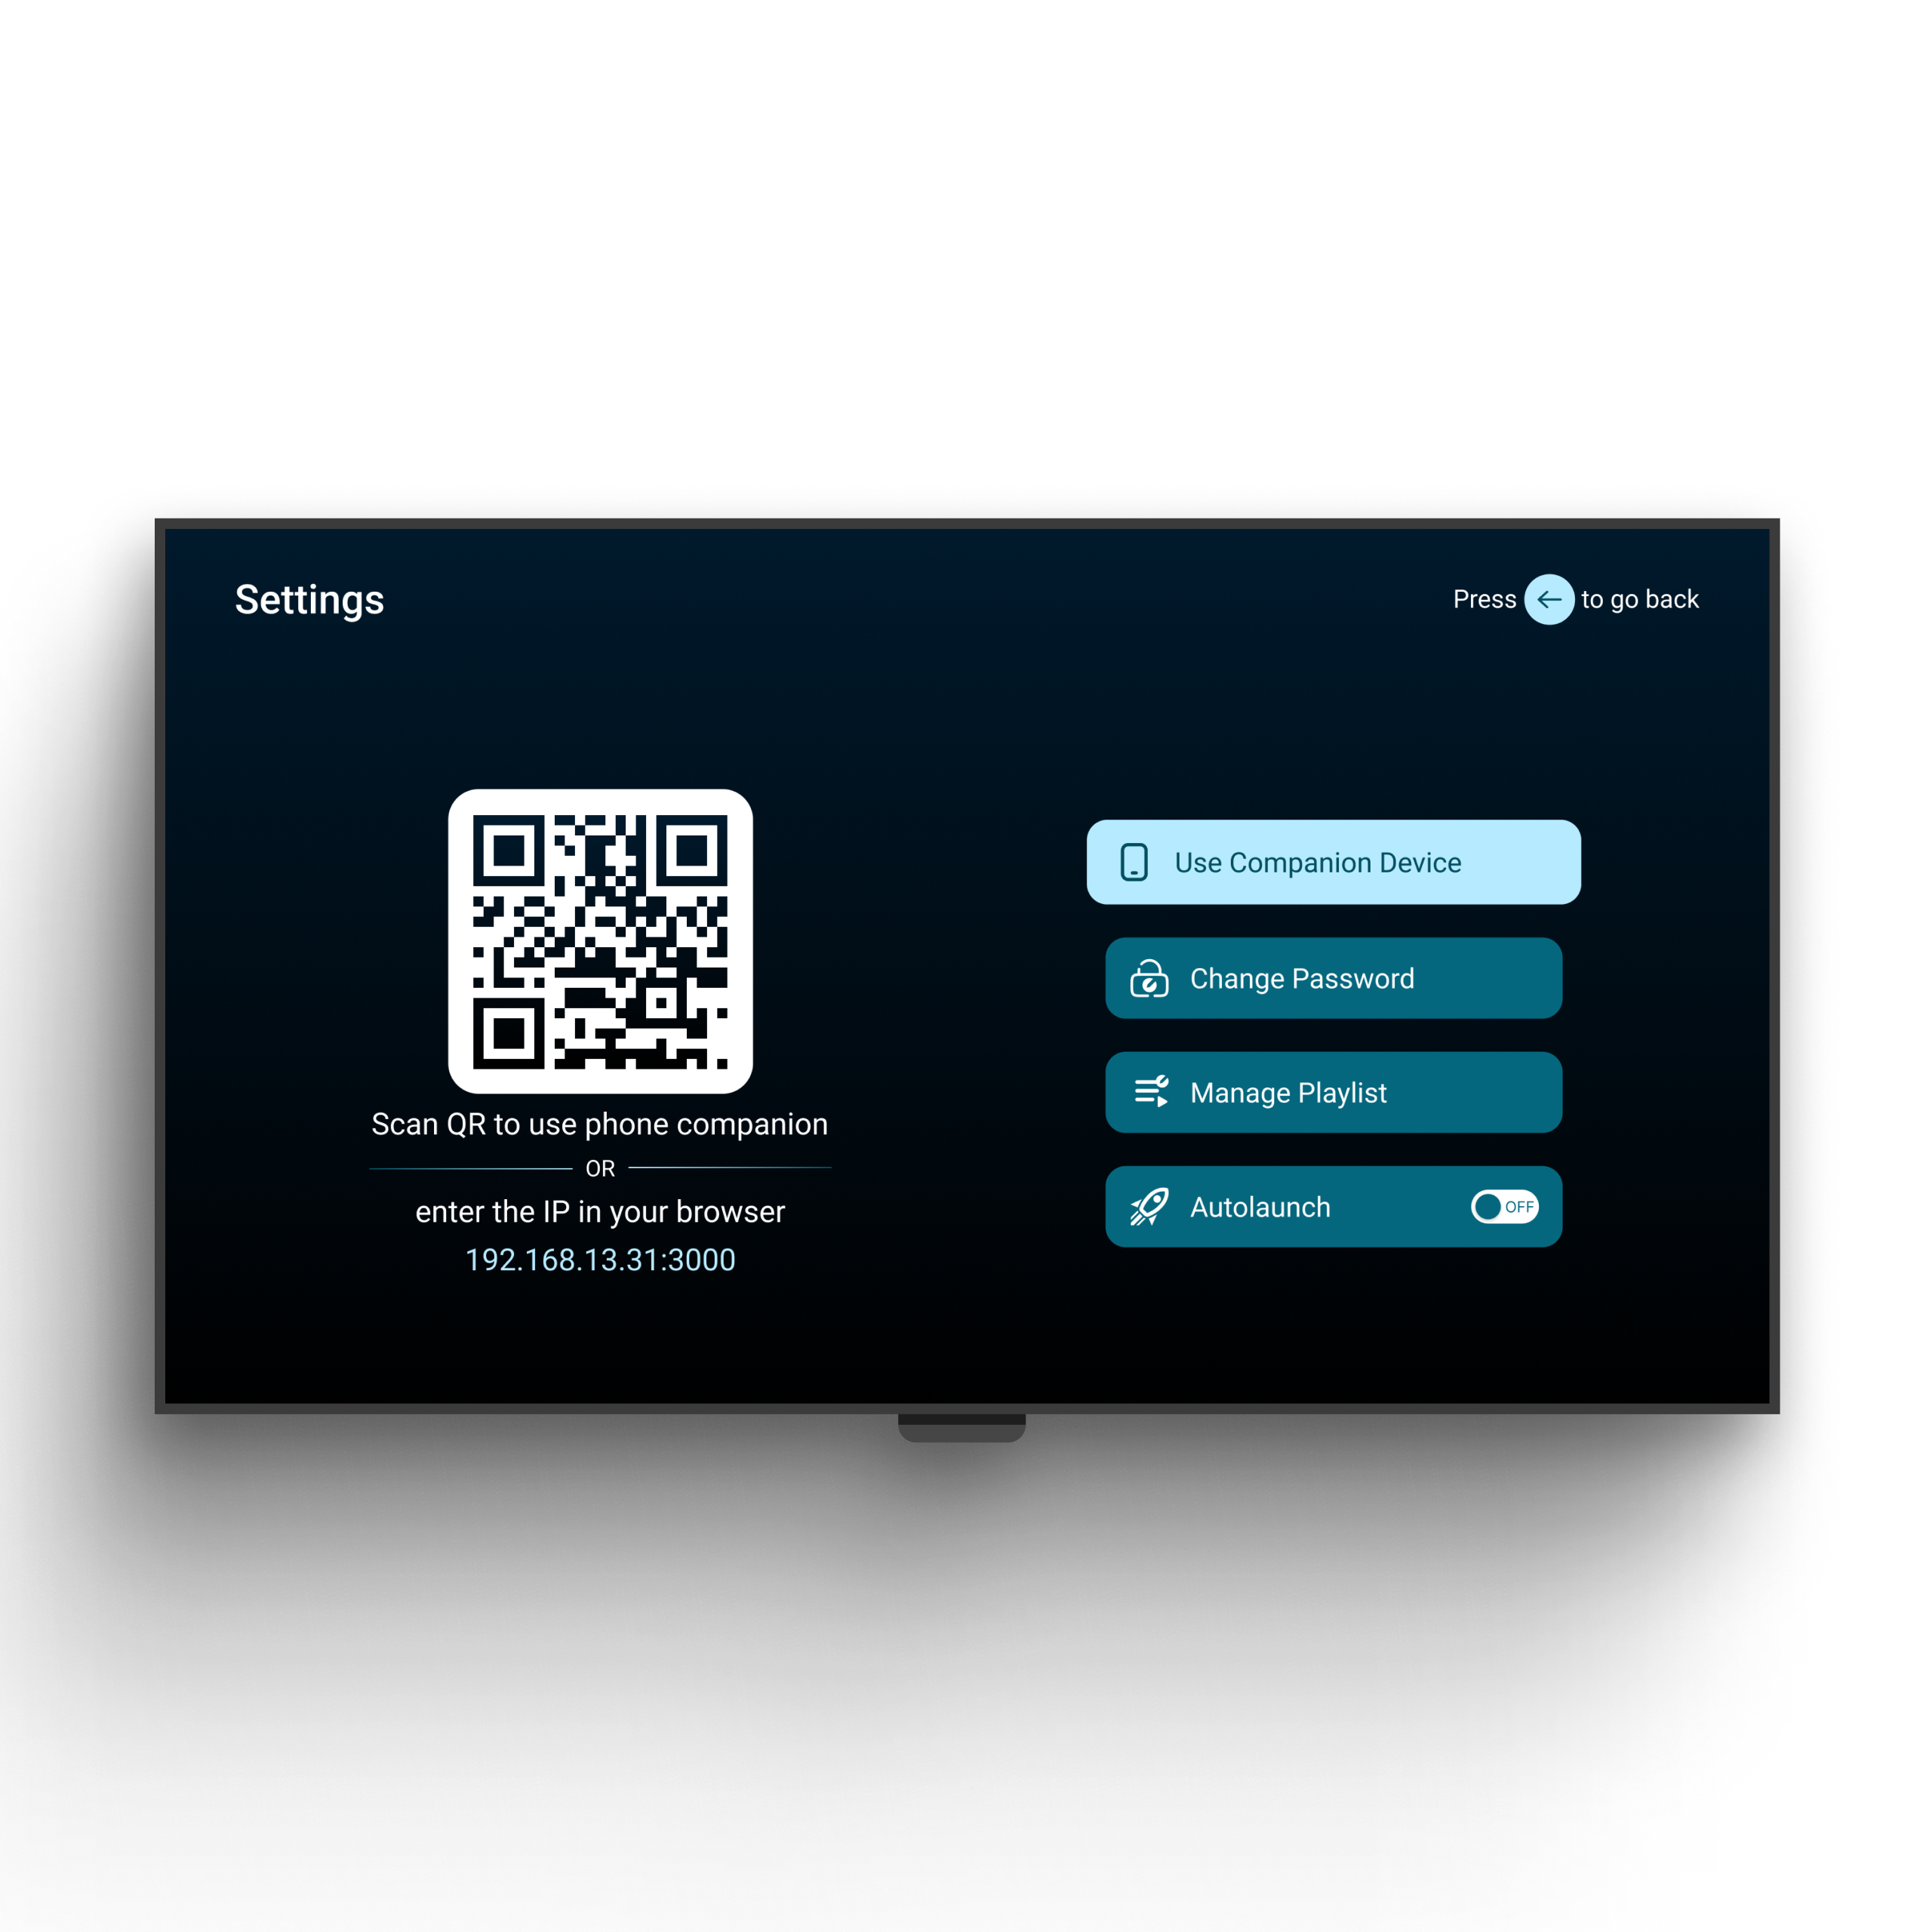
Real-Time Deployment Tracking: Scanning a QR code during deployment updates
the system with location, date, and time.
Analytics & Reports: Generates detailed reports on deployment trends
and inventory usage.
Inventory Insights: Tracks unused inventory at WDs.
Maintenance Alerts: Flags POSMs for refurbishment based on deployment
duration.
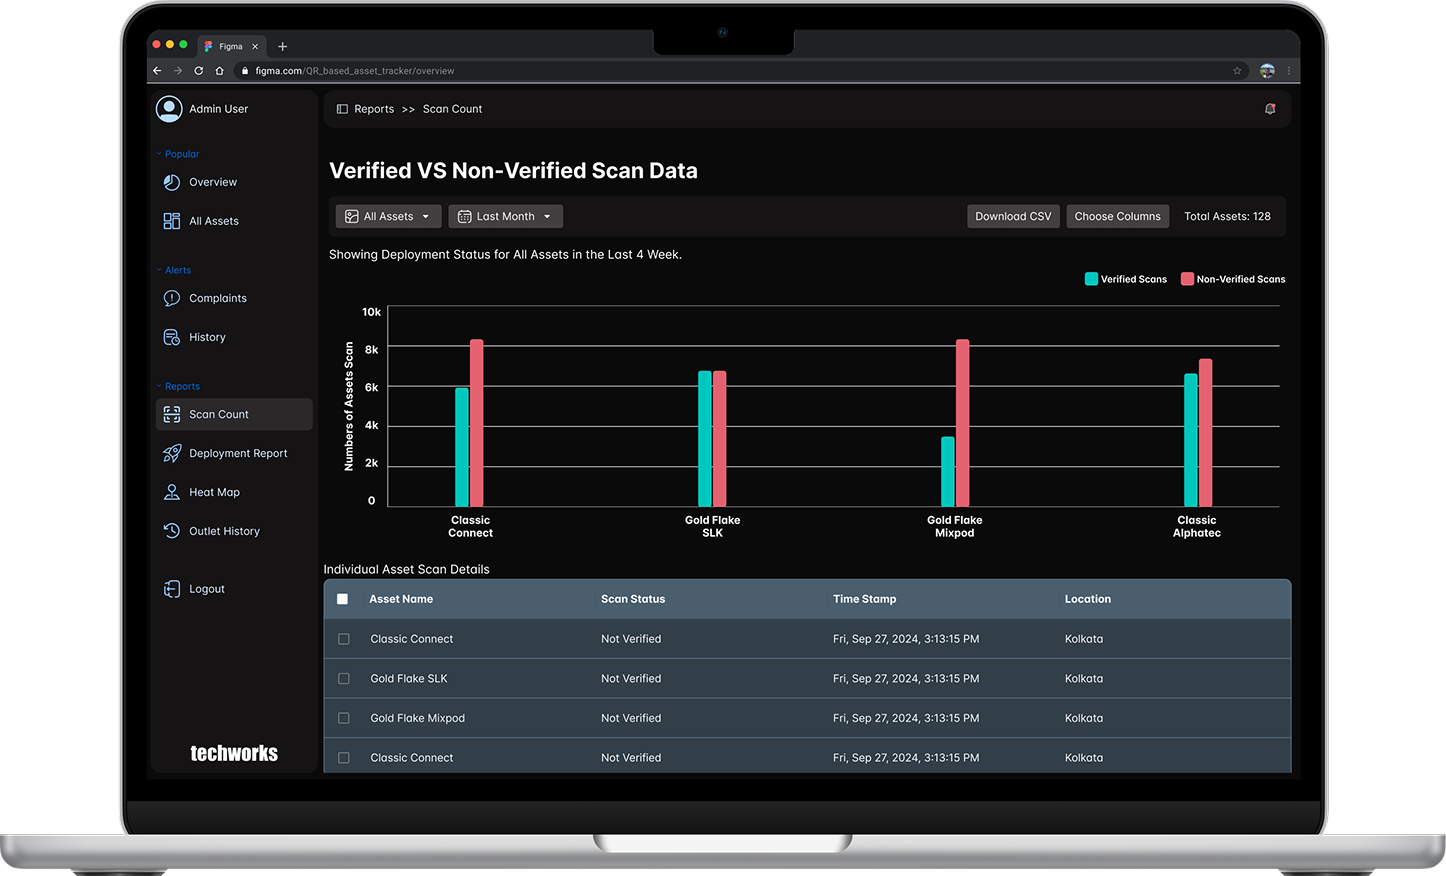
Reporting - The Soul of the Dashboard
Scan Count Report
This report keeps track of all the verified and non-verified scans along with their time stamps
and geo-location.This reports is the most important as the majority of analysis is done based on
this only.
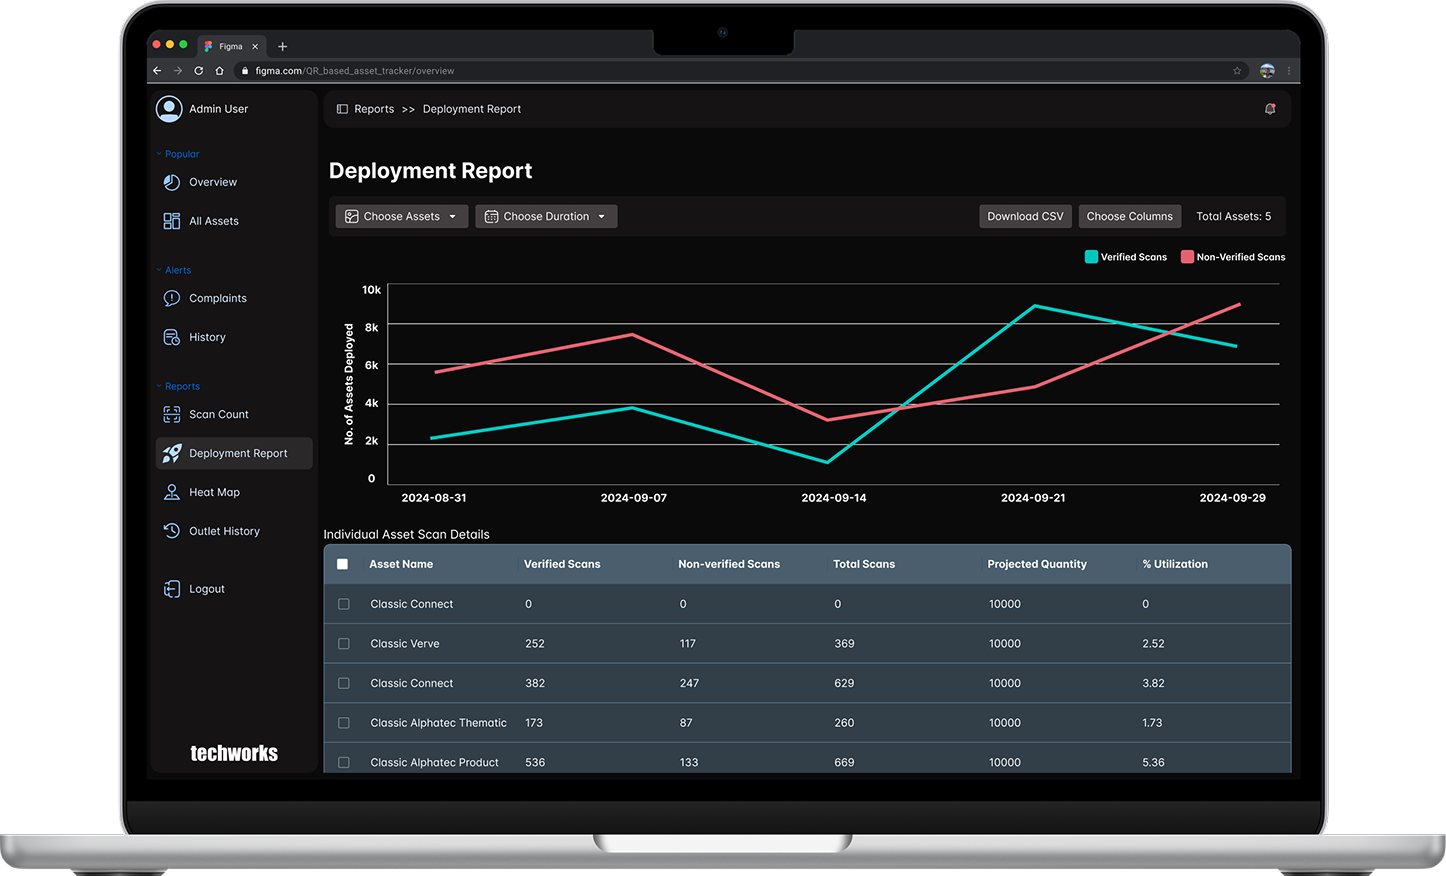
Deployement Report
The deployment report offers a comprehensive overview of the total assets deployed and the
percentage of assets that have been utilized, providing valuable insights into operational
efficiency. By default the page shows all assets deployed in the past weeks.
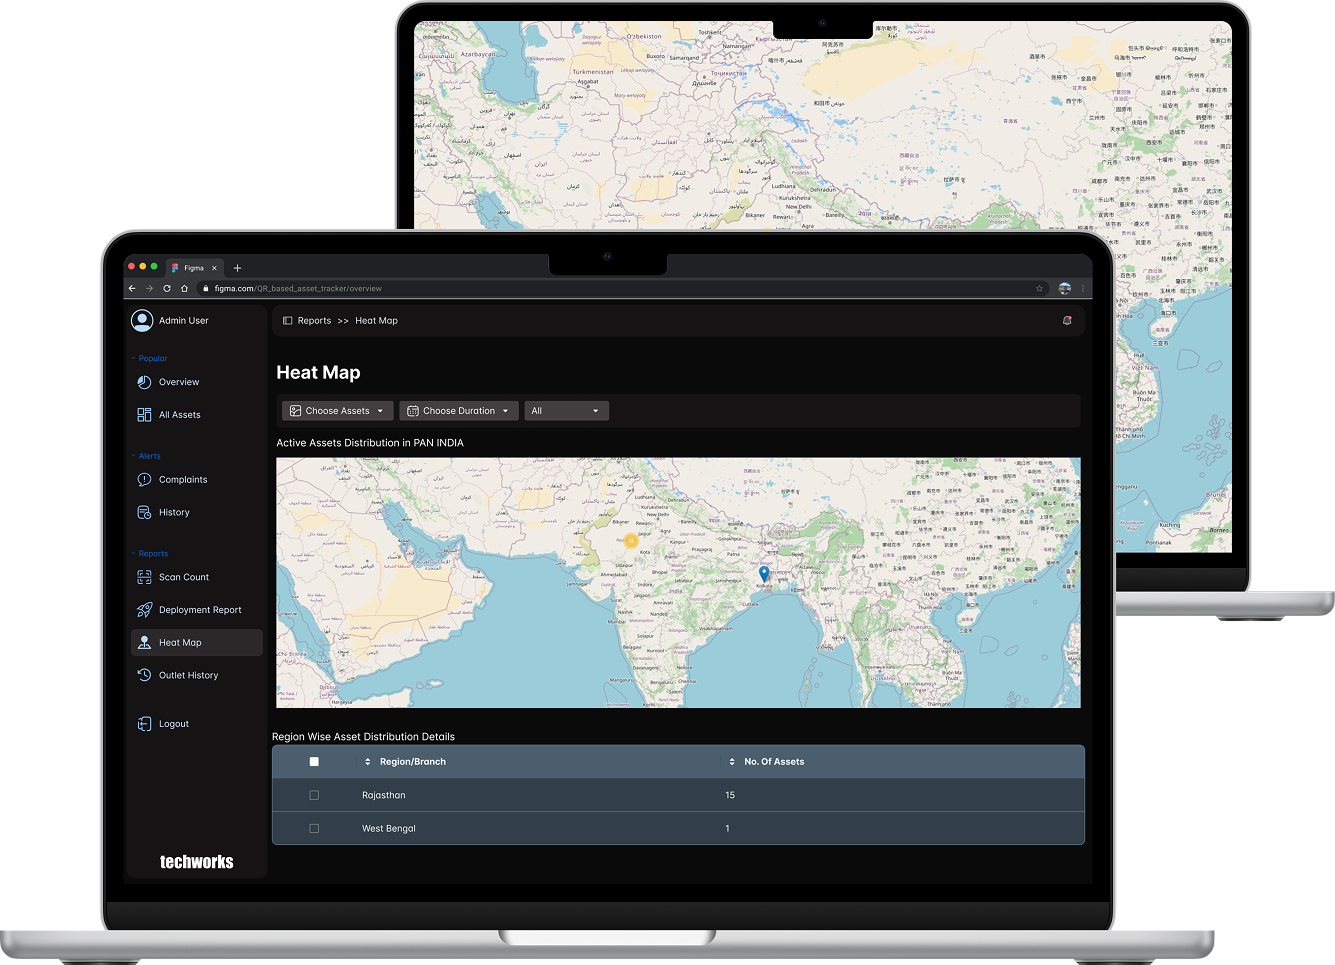
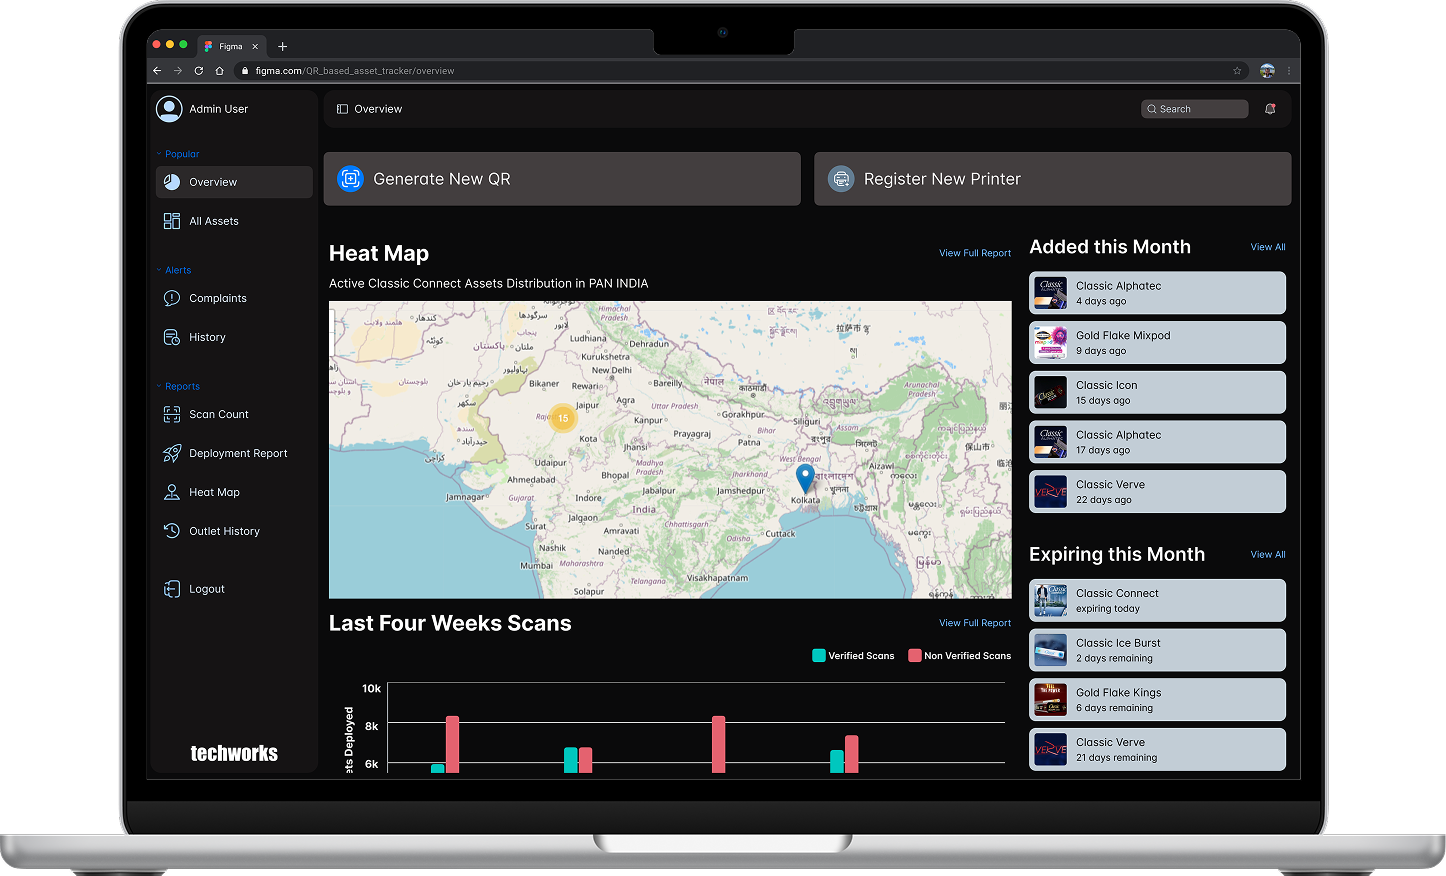
Heat Map Report
Heat maps serve as a robust method for visually representing the distribution of assets across
different regions. Areas with darker shades signify elevated scan counts, indicating a higher
level of asset deployment. If you wish to examine a particular asset within a specific date
range, you can easily do so by selecting your preferences to generate the corresponding heat
map.
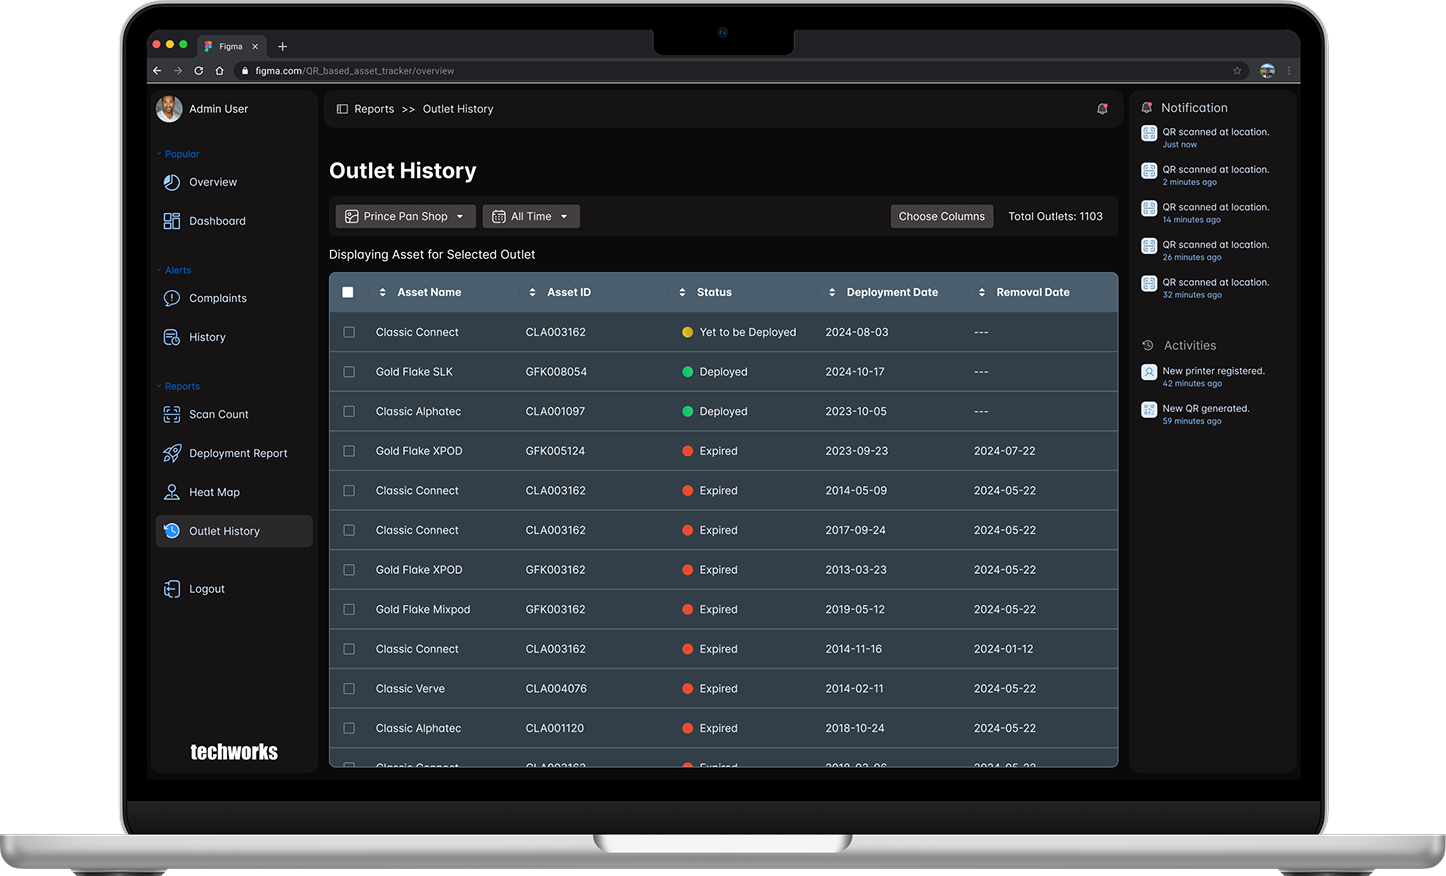
Outlet History Report
The Outlet history keeps track of all the asset that have been deployed to a particular outlet.
To view the outlet history, choose an outlet and then choose the date range from the following
options:
Last week
Last month
Last 3 months
All time
Custom Date Range
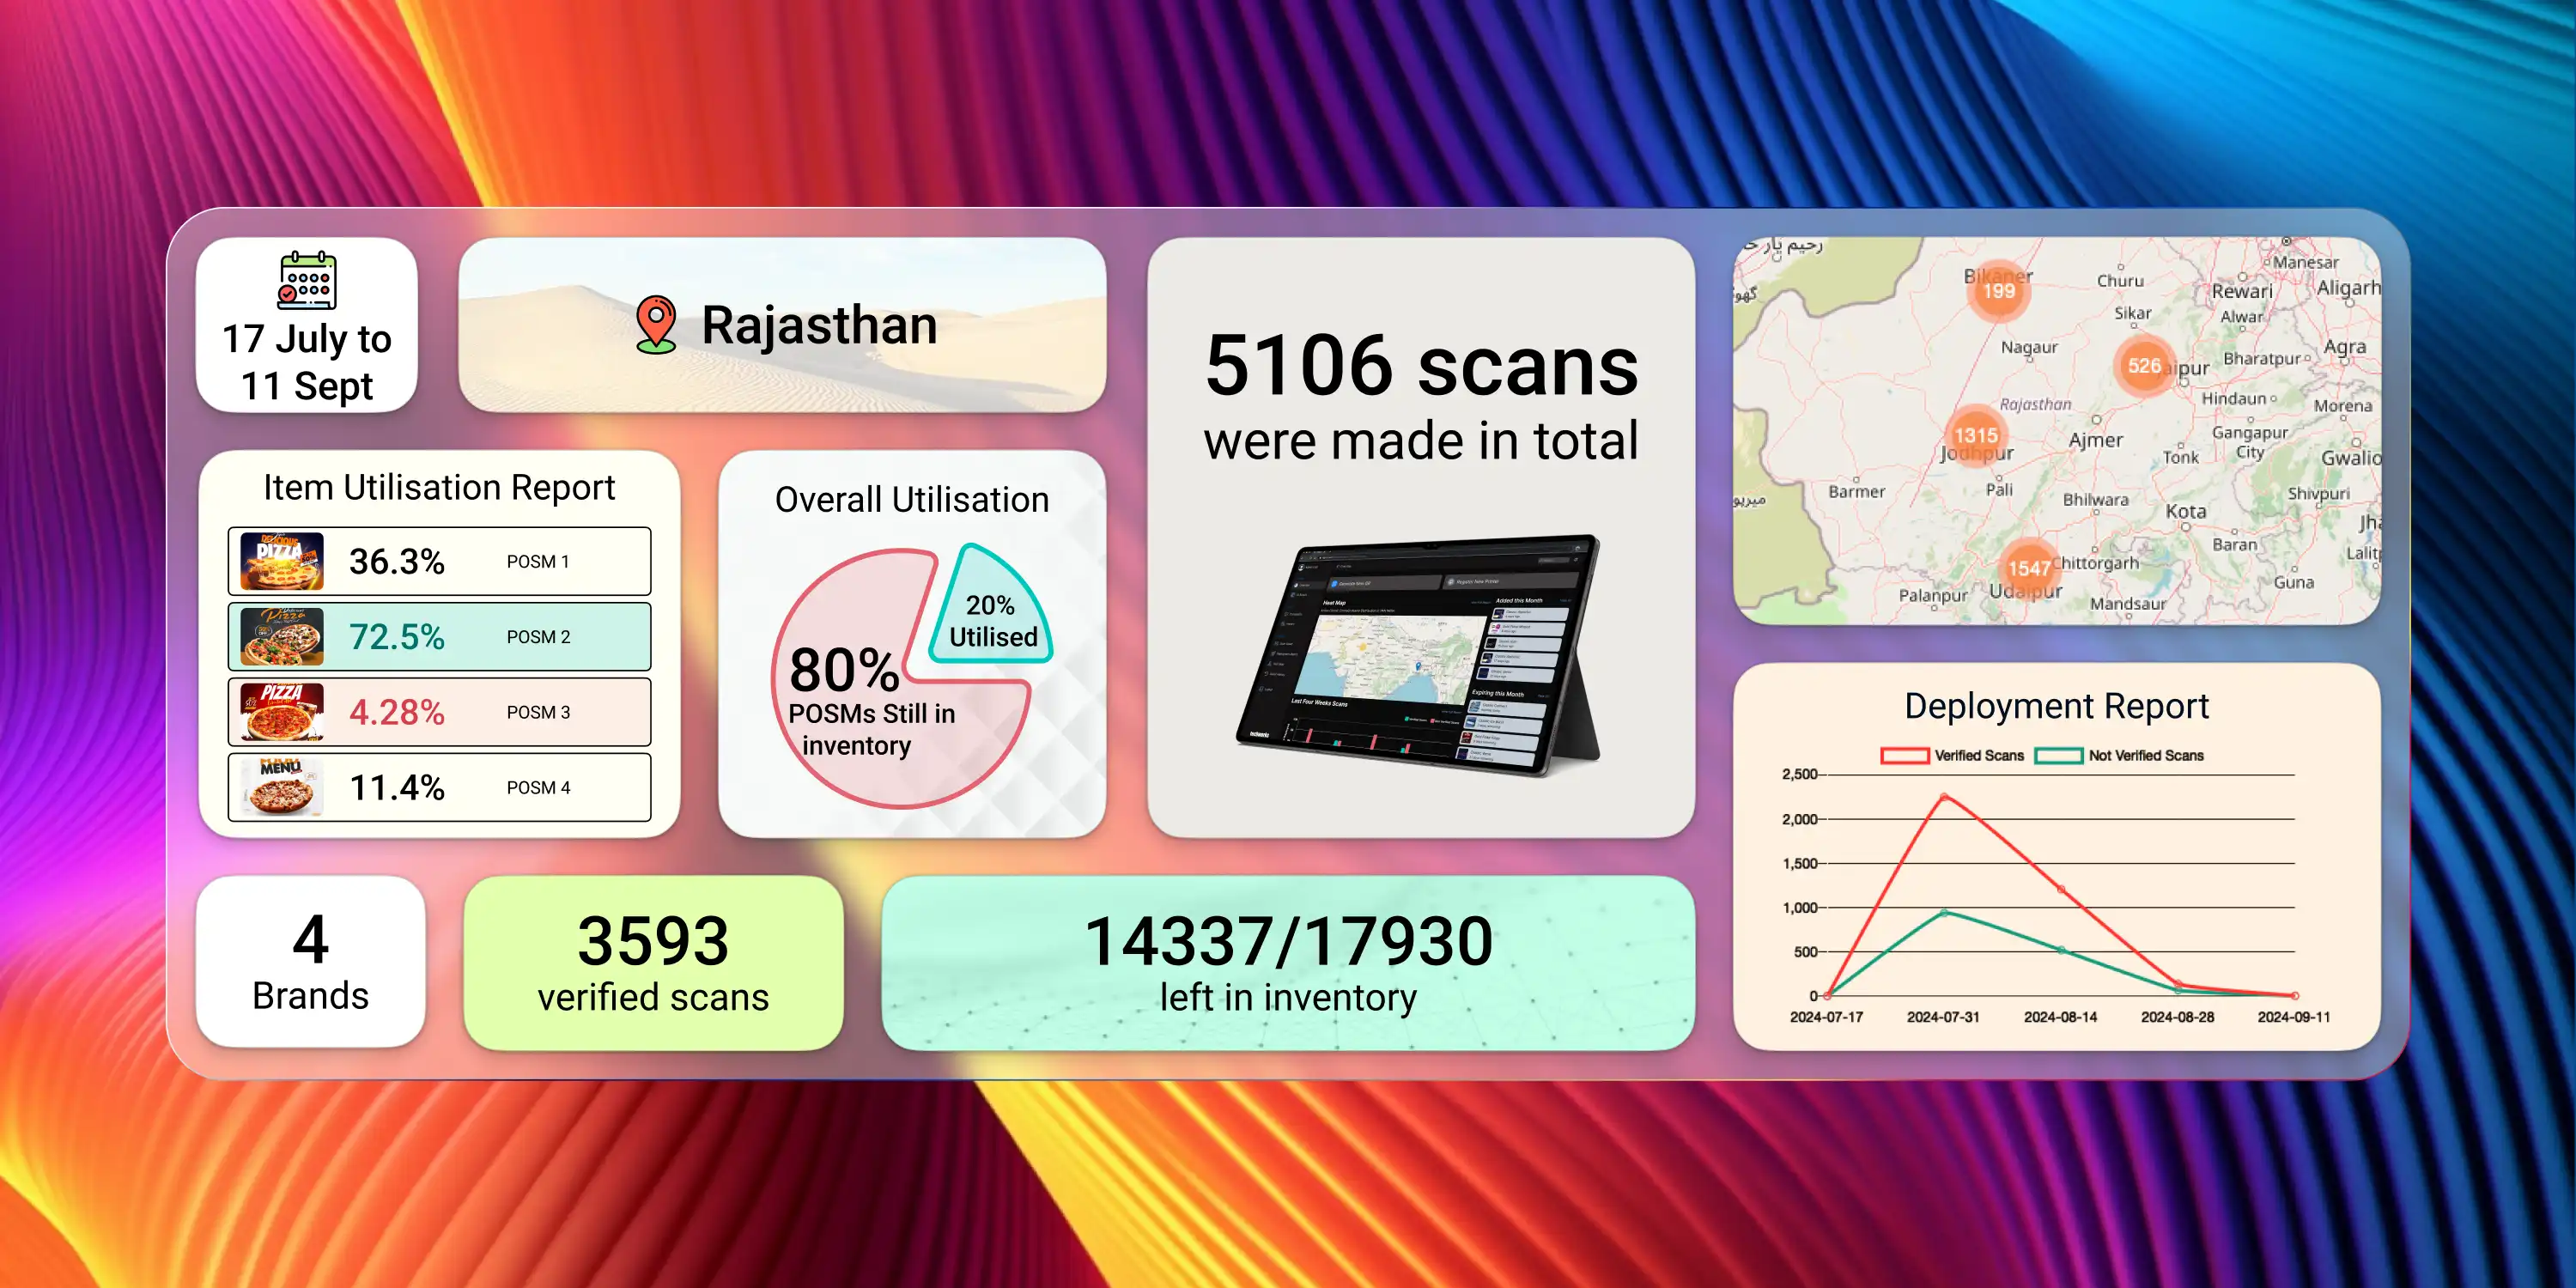
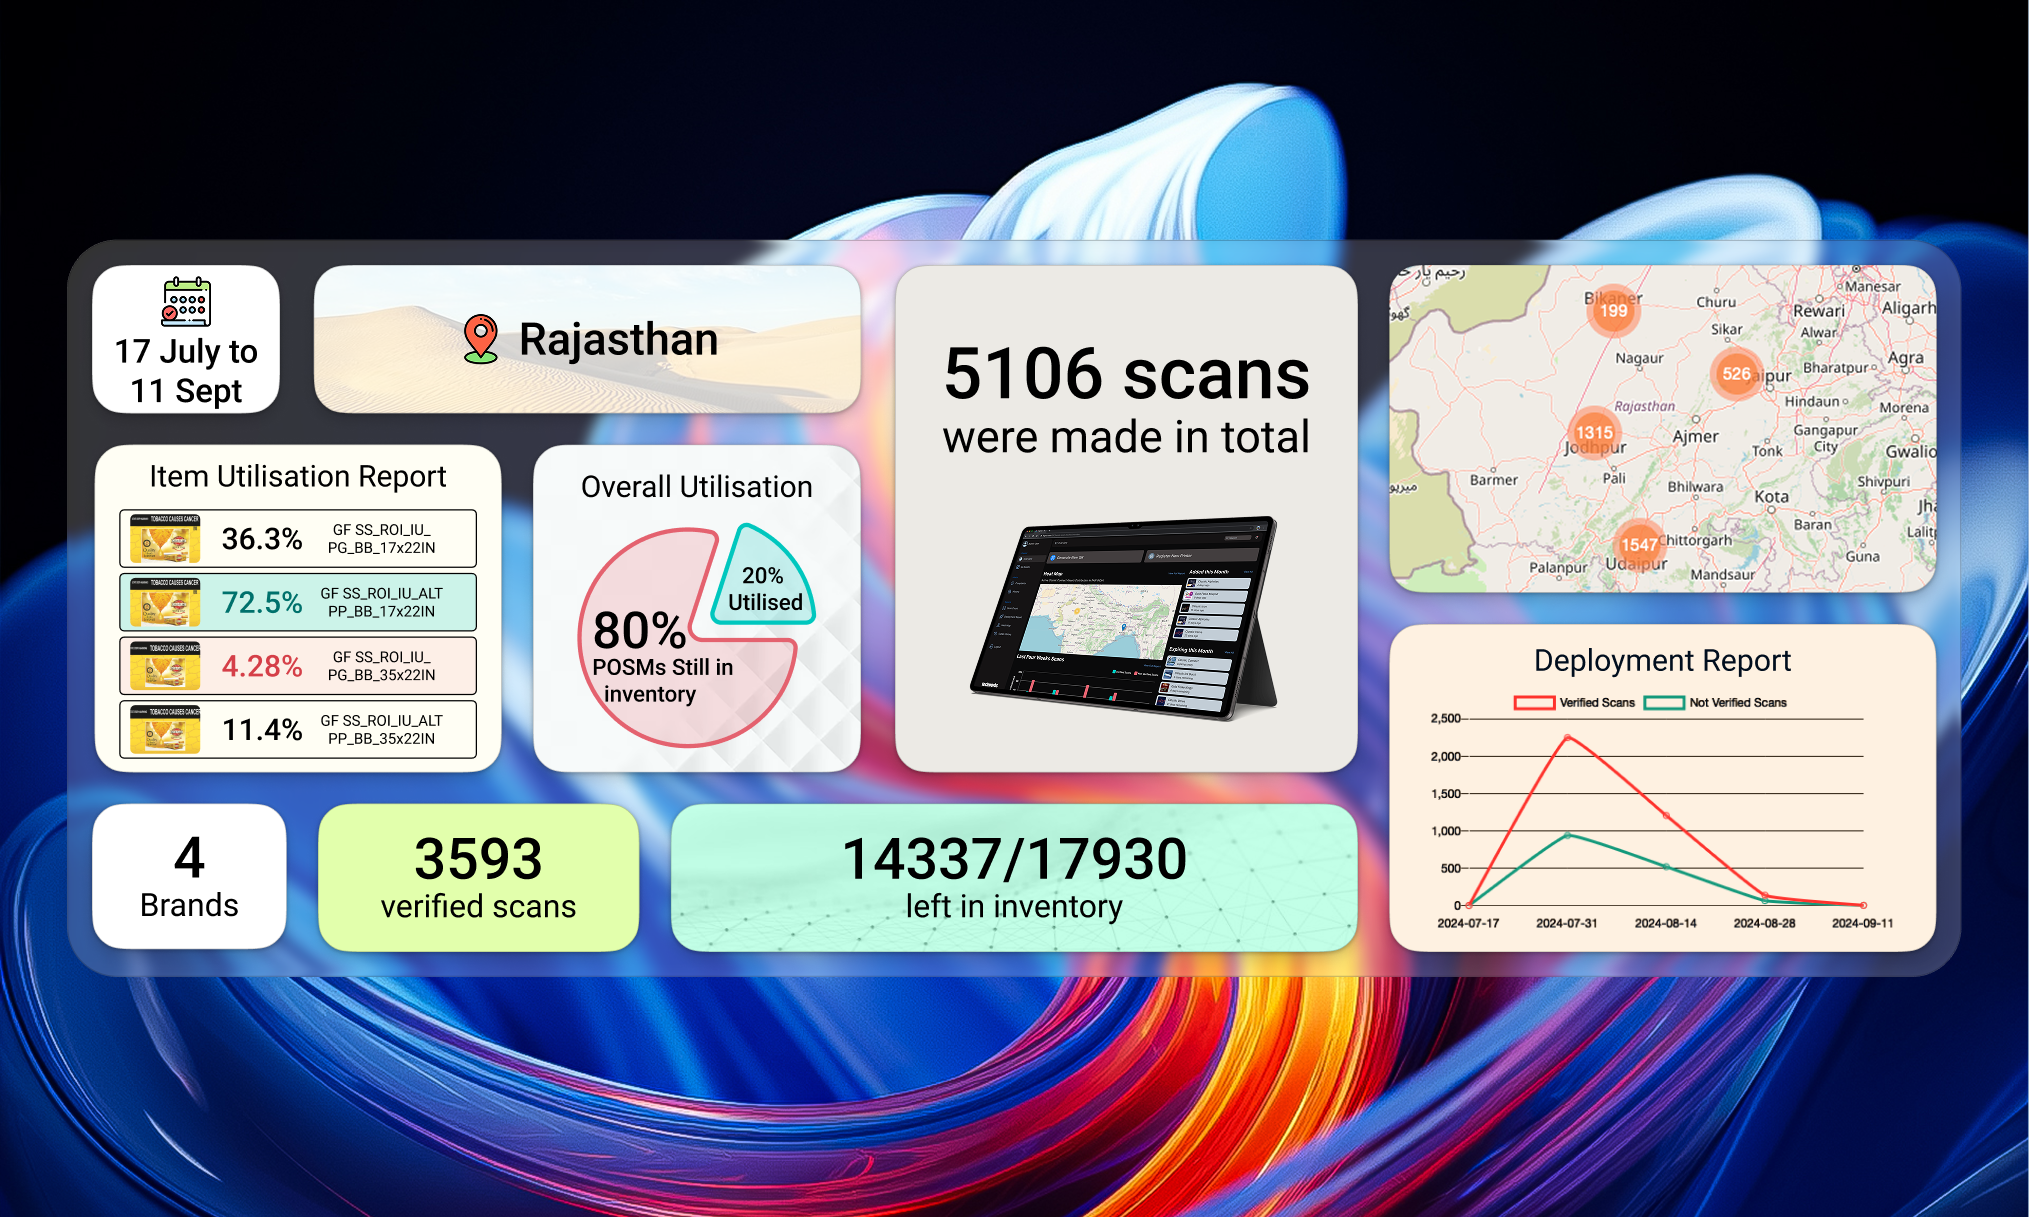
Experimentation & Feedback
To test Codify, we printed 17,000 POSMs and deployed
5,000 in Rajasthan, India.
Deployment teams scanned QR codes during installation.
Feedback highlighted the system’s ease of use and the accuracy of deployment data.
Impact
Reduced resource wastage by tracking unused inventory.
Provided real-time insights into POSM journeys and brand-specific deployments.
Eliminated manual tracking processes, saving time for deployment team
Enabled companies to optimize future POSM campaigns based on analytics.
Conclusion
Codify is more than a dashboard; it is a catalyst for transformation in POSM management. By
addressing key pain points, it empowers brands to make smarter, data-driven decisions, saving
significant resources while enhancing retail marketing effectiveness.
Key Takeaways
Codify demonstrates the power of combining simplicity with technology to solve real-world
problems. By enabling traceability, enhancing visibility, and streamlining processes, Codify
delivers value across all levels of the POSM lifecycle.
Next Steps
We aim to:
Scale Codify to additional regions.
Integrate AI-driven insights for predictive analytics.
Explore RFID integration for enhanced tracking capabilities.